


Hi,
I'm collecting screenshots (and explanation if needed) of visualisations that you found useful. It could be charts, maps, tables etc...
This could come from research papers, spreadsheets or other applications but any idea is welcome.
Here are a few that I collected so far:
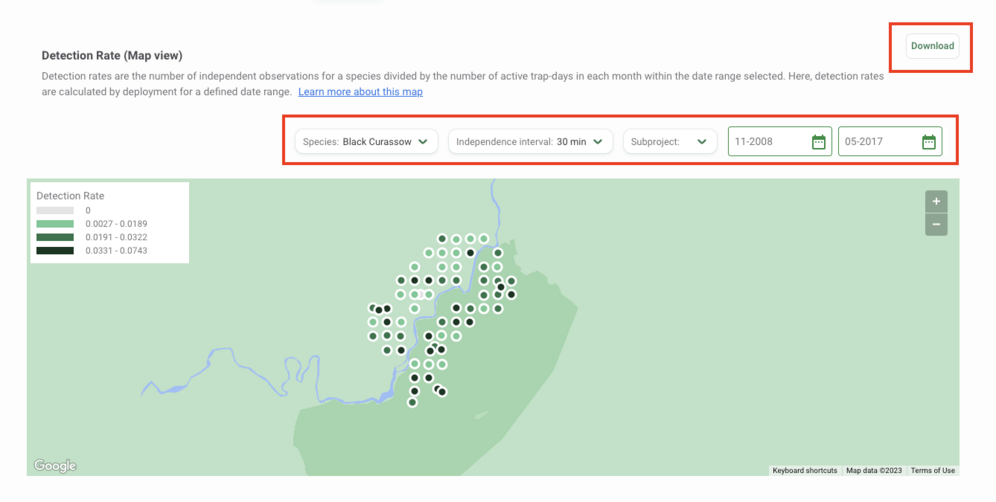
- from wildlife insights
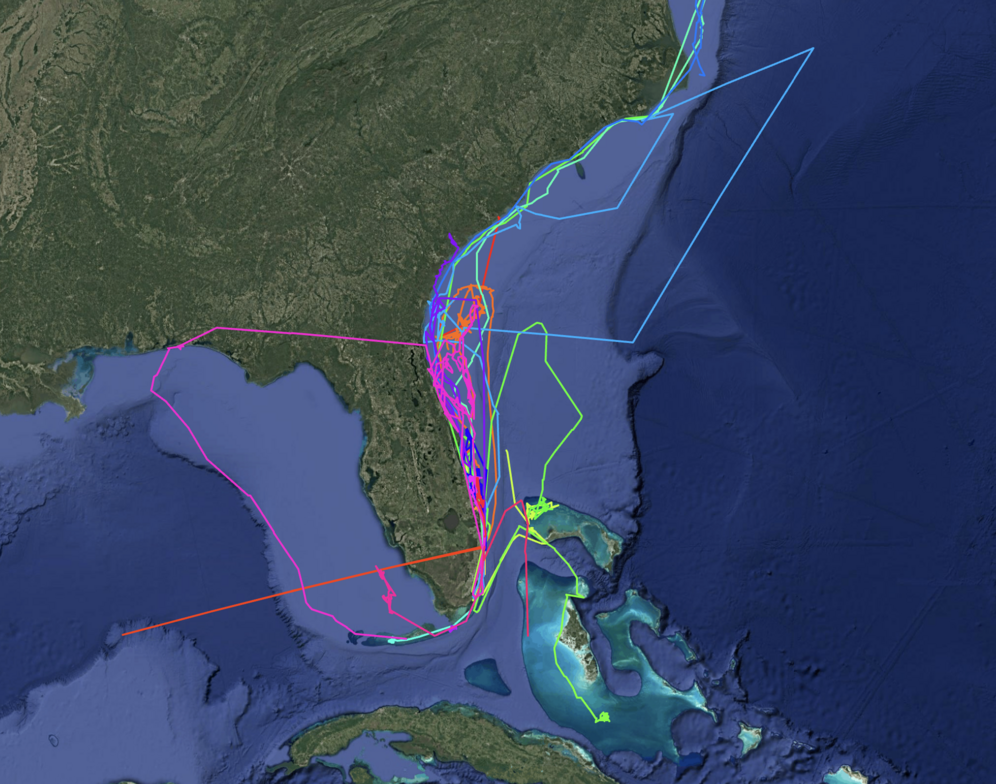
- tracking turtles from https://my.wildlifecomputers.com/data/map/?id=5e542348e9b35143424598b3
What are your favorite ones?