
Phil Wilkes
LiDAR works on the principle of firing hundreds of thousands of laser pulses a second that measure the distance to an intercepting surface. This harmless barrage of light creates a highly accurate 3D image of the target – whether it’s an elephant, a Cambodian temple or pedestrians walking down the street. LiDAR has made the news over recent years for its ability to unearth ancient temples through thick jungle, but for those of us with an ecological motive it is the otherwise impenetrable cloak of vegetation which is of more interest.

Like an X-ray, airborne LiDAR allows you to peer through the dense canopy, revealing the structure of the forest beneath. © Robert Kerton, CSIRO
Airborne LiDAR in Forests
As it was National Tree Week in the UK when I wrote this, the focus of this blog post will be on the application of LiDAR in forests. There are a number of techniques that use LiDAR in forests, across a range of scales, from handheld, backpack and tripod mounted terrestrial laser scanners to spaceborne instruments on the International Space Station.
However over recent years, the most prolific and operational use of LiDAR for forest applications has been via an instrument mounted on the underbelly of an aircraft flying a kilometre above the canopy; a technique known as Airborne Laser Scanning or ALS. Much like traditional aerial imagery, being attached to an aircraft allows for a synoptic view of the forest below. But, ALS differs from aerial imagery in that laser pulses can penetrate through the canopy and reveal top-to-bottom 3D structural detail of the forest. For these reasons ALS (and LiDAR techniques more generally) is now recognised as key for assessing Essential Climate and Biological Variables (ECVs and EBVs respectively) such as biomass and habitat configuration.

An animation of forest structure being captured by an Airborne Laser Scanner. Green points have been classified as vegetation and brown points as ground.
Unlimited Structural Information (Almost)
The structural information that can be extracted from ALS data is almost unlimited. Applications of these derived metrics include understanding forest succession (i.e. how the range and size of tree species changes with time or disturbance) mapping habitat structure and measuring very large trees in far off forests, to name but a few. This information can be rasterised, or gridded, into map products depicting the ground (Digital Elevation Models (DEMs)) and the top of canopy surface (Canopy Surface Models (CSMs)). This level of information has been used to estimate biomass over Peru, map spider populations in Germany and fire risk in Australia.
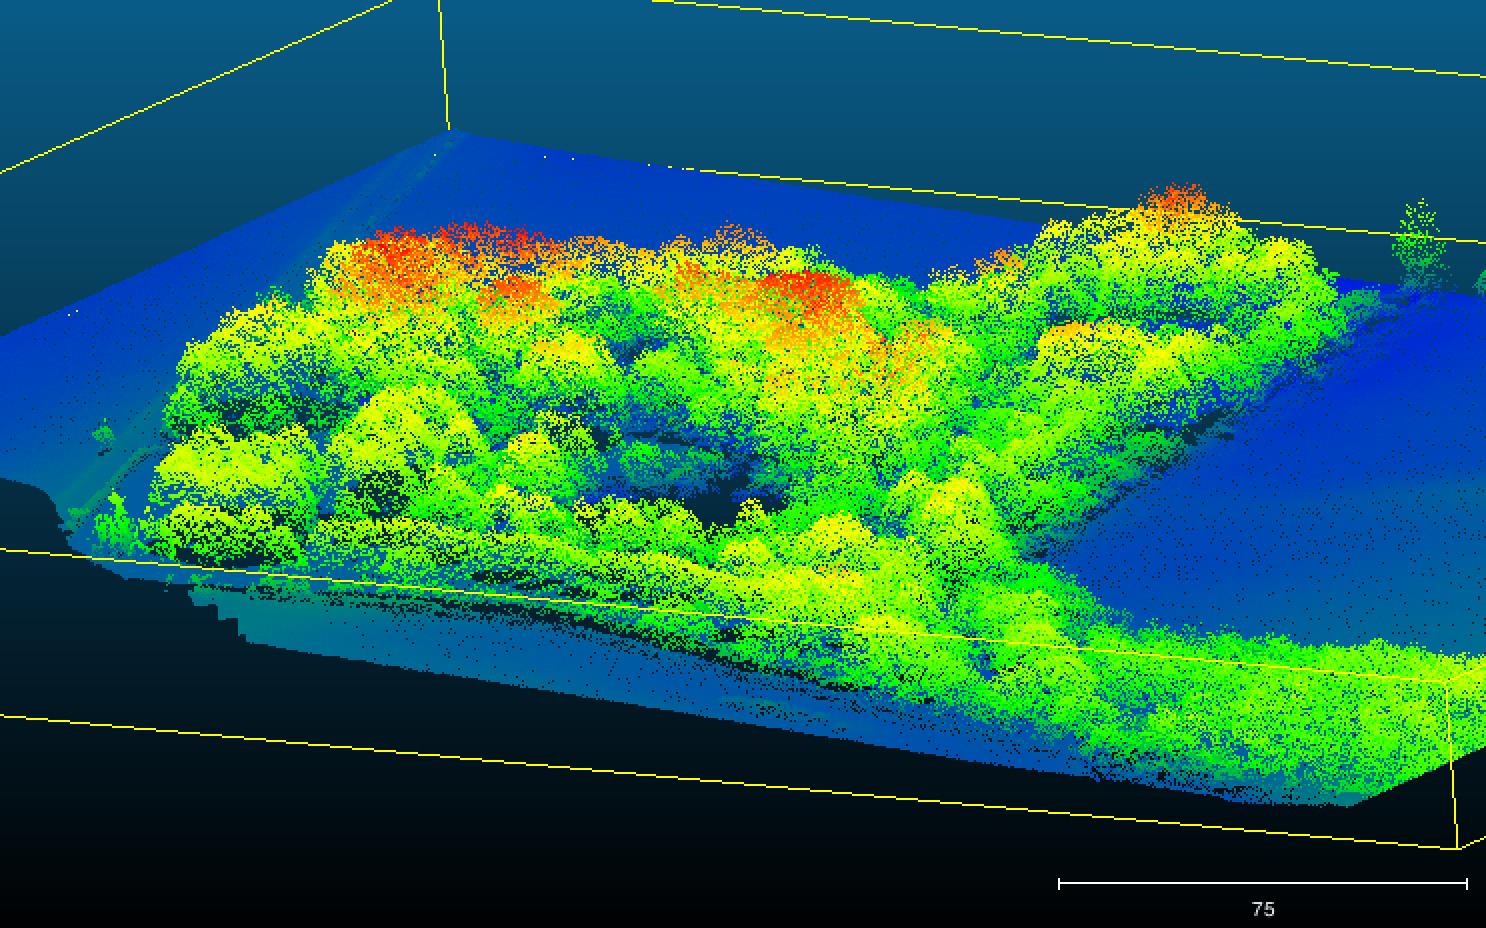
If you delve a little deeper into the raw data, there is a wealth of information contained within the “point cloud” (see image below). This is essentially a long list of xyz coordinates (and some other metadata) which can reveal the distribution and connectivity of vegetation to a level of detail that could never be captured at such a scale with traditional forest inventory.
Extracting Canopy Layers with Airborne LiDAR
Our article published in Methods in Ecology and Evolution used ALS data to deduce the number of canopy layers in forests, something that would be unachievable with optical remote sensing and only possible to a limited spatial area with traditional field methods. Applying this method across landscapes now means we no longer have to make assumptions about forest structure. This is particularly important for unmanaged forest systems where horizontal structure can be highly variable and forest succession is not always linear.
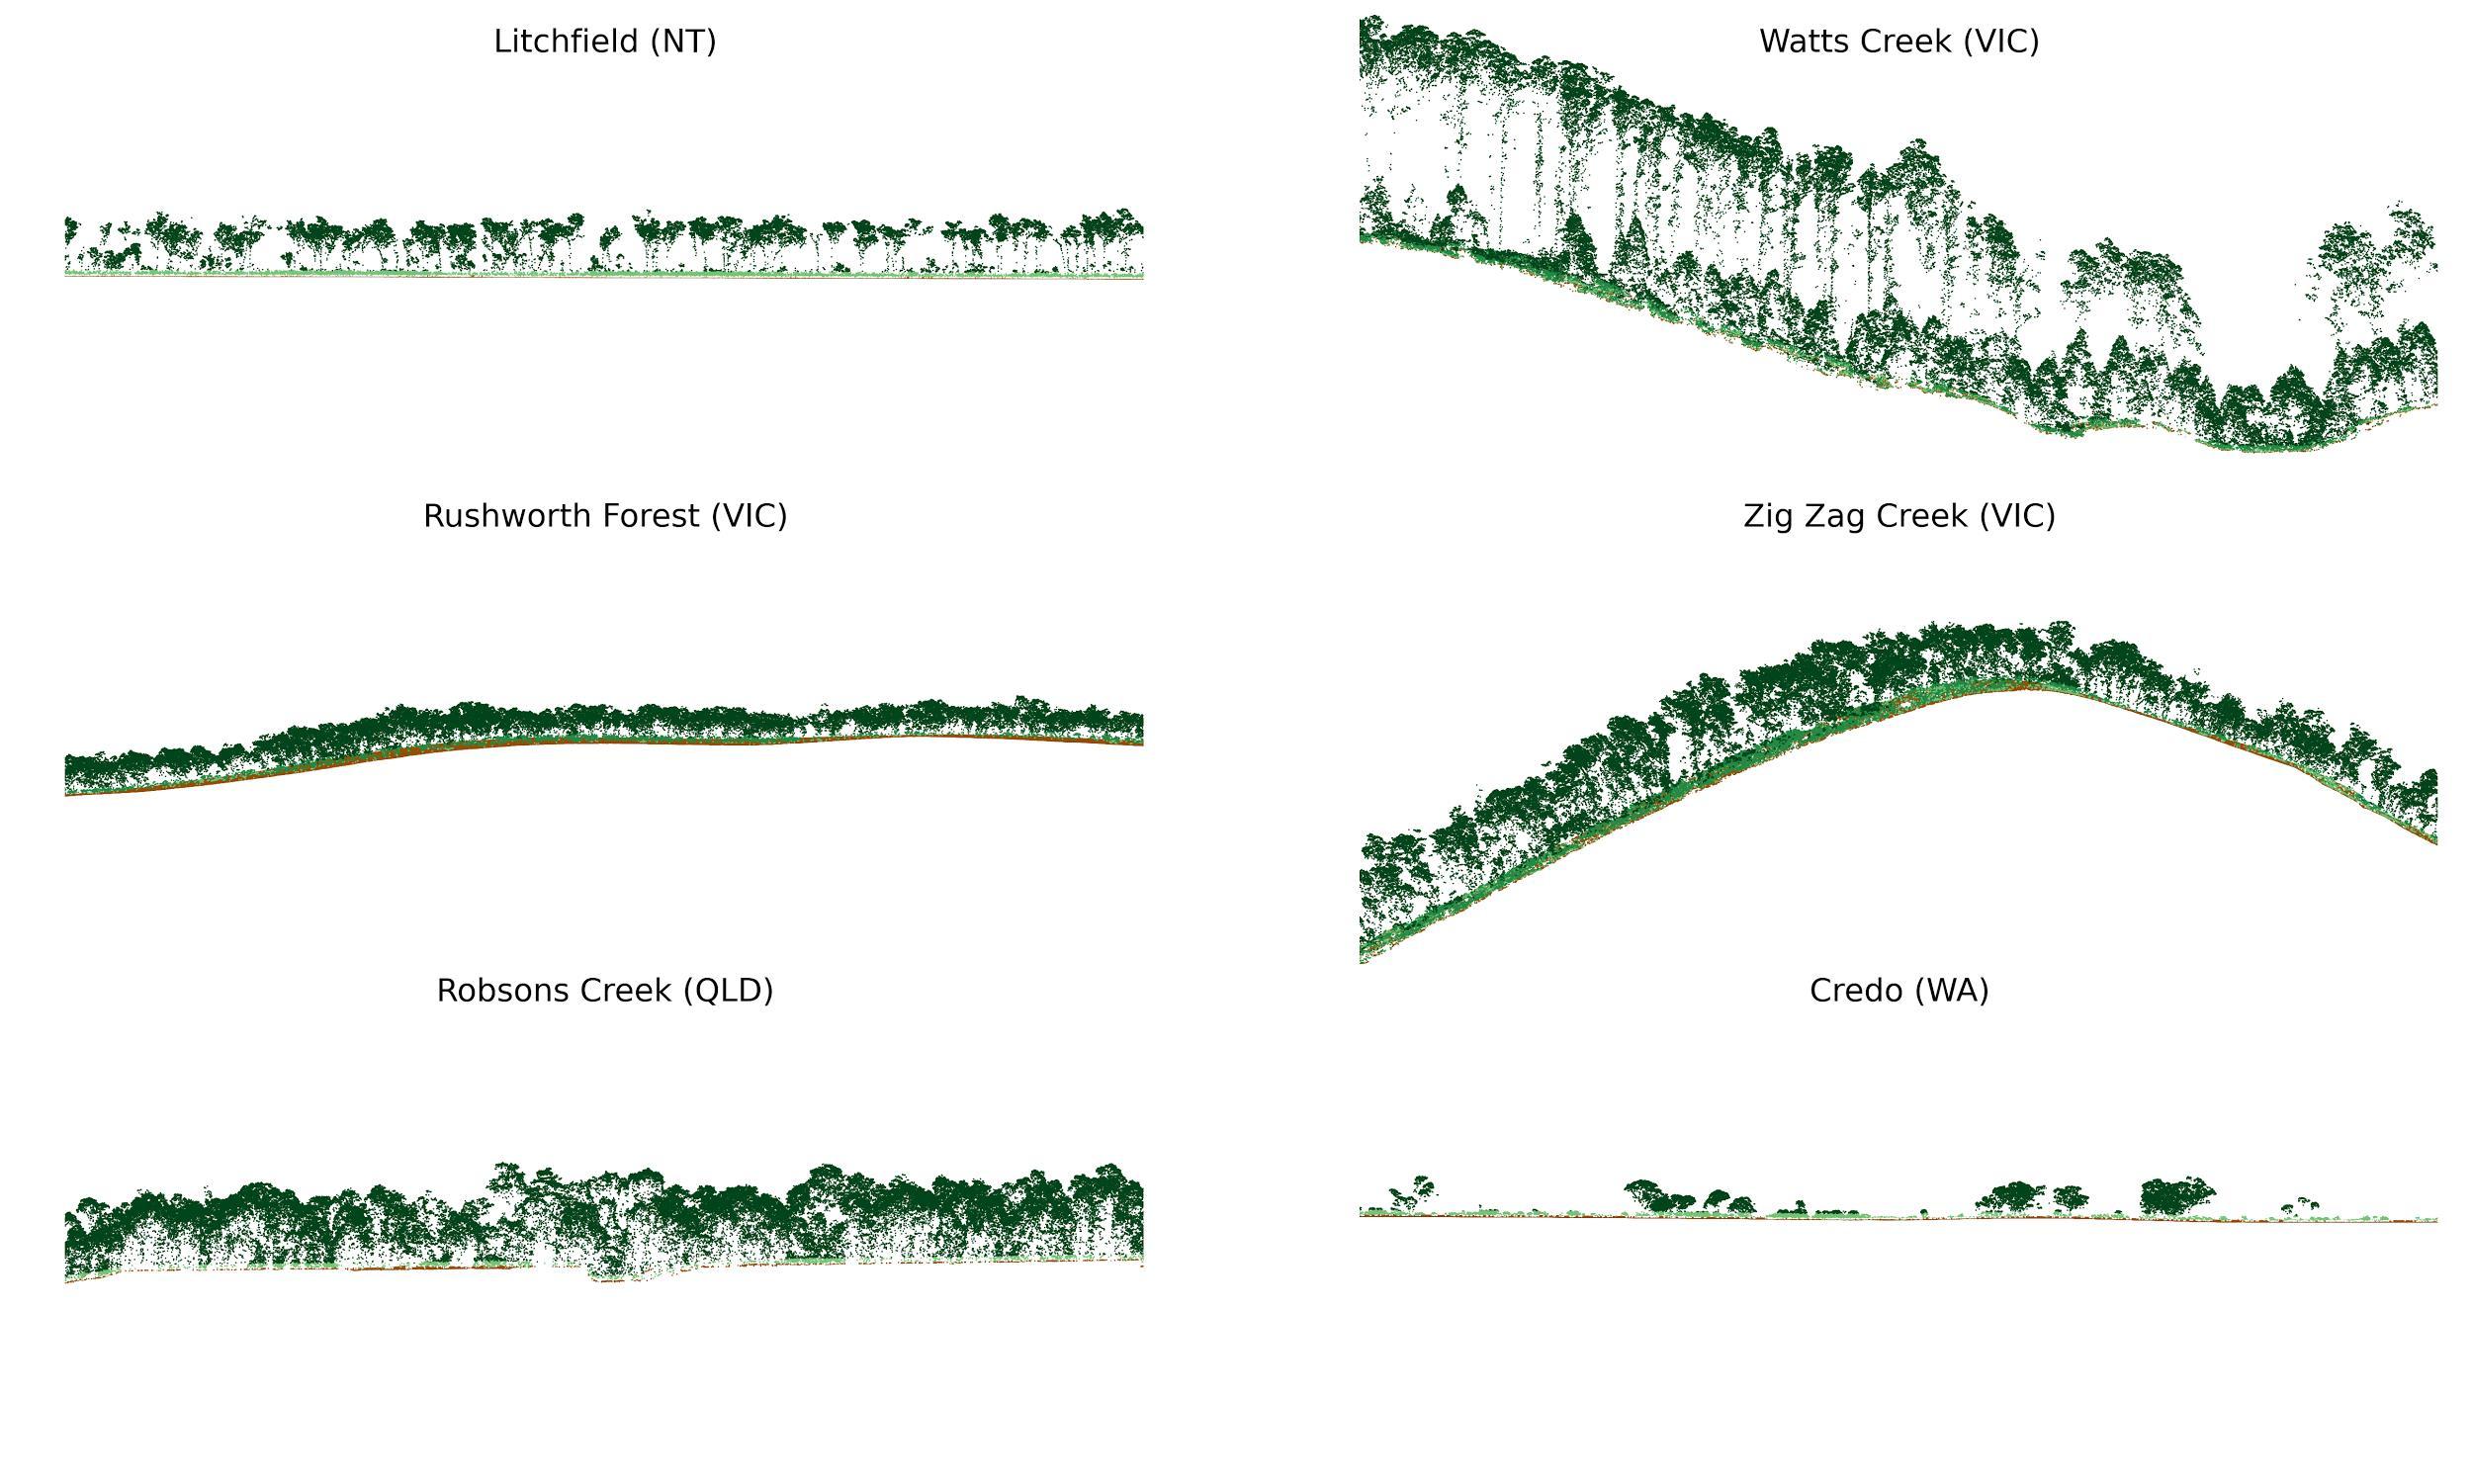
Examples of the forest structure and topography derived from ALS point clouds. These examples are taken from TERN data captured at 6 sites across Australia.
Breaking Down the Barriers to LiDAR
For many, a barrier to using LiDAR is processing the data. Don’t be shy, there are now a number of free and open source software tools that can be used to access, process and visualise point cloud data (see CloudCompare, potree, pyLiDAR or rLiDAR). These packages can transform binary LiDAR data into a simple array, which can then be analysed in your favourite statistical software package using many traditional and new statistical methods. ALS data sets can be large, but as with any spatial dataset, the data can be “tiled” or “chunked” to simplify processing workflows.
Until recently, ALS has been expensive to capture and process. However, as with other remote sensing datasets, many countries and government agencies are now providing free access to (at least parts of) their vast archives of data. For example, the UK’s Environment Agency has recently opened their archive and made available processed ALS (DEMs and Digital Surface Models or DSMs), as well as the raw data, for over 70% of the British Isles.

A birds eye view of a small wood near Oxford, made from ALS data captured by the Environment Agency.
An oblique view of the wood above revealing horizontal structural heterogeneity.
Elsewhere, large investments are being made in capturing ALS data at sub-continental scales; whole countries have been criss-crossed, there is a large transect of data across Boreal Canada and transects along all major rivers in Victoria, Australia for example. Of course, ALS does not have to be used in isolation, it can be used as training data in conjunction with, for example satellite imagery, for extrapolating forest structure beyond the confines of the capture swath.

ALS data can be usedfor “urban forestry”, streets and park trees are clearly visible.
A Baseline for Future Monitoring
With the increasingly pressing issues of measuring, managing and adapting to change in the modern world – in particular changing land use – the need for cost-effective, synoptic, timely and continuous monitoring data is clear. ALS data may not yet be considered to fully address any of these issues, yet ALS data provides a useful and information rich baseline or reference dataset for monitoring activities. It’s important to keep in mind that ALS data (as with other remote sensing data) will never replace the requirement for detailed inventory measurements.
So go on, roll up your sleeves, download some ALS data and see what is lurking below the canopy.
To find out more about ALS, read our Methods in Ecology and Evolution article ‘Using discrete-return airborne laser scanning to quantify number of canopy strata across diverse forest types’.
About the Author
Dr. Phil Wilkes is National Centre for Earth Observation funded Post Doctoral Research Associate at University College London. His research focuses on earth observation techniques, particularly Terrestrial Laser Scanning, to quantify forest structure for estimating biomass. Phil earned his undergraduate degree from the University of Plymouth, a MSc from Kings College London and completed his PhD at the RMIT, Melbourne where his research topic was the development of multi-scale tools to characterise vegetation structure across regional areas.
I would like to thank the co-authors of our MEE paper as well as Mat Disney (UCL) for their helpful comments and suggestions.
The three images in the ‘Breaking Down the Barriers to LiDAR’ section were generated using point data from Environment Agency dataset. Data can be accessed here.
This article first appeared on the Methods in Ecology and Evolution blog and was republished with permission.
Add the first post in this thread.