
Cassie Anderson
- @CassieAnderson
- | she/her

Professor Iain H Woodhouse reviews the Meta Global Canopy Height (1m) dataset available with no-code access on Earth Blox.
Meta and World Resources Institute (WRI) have made a big move by launching a global canopy height model with a ground pixel size of 1m, and making it free for everyone to use. It is by no means the finished article, and they admit this themselves, but it does take us one step closer to having the kind of forest data that would otherwise require expensive airborne laser scanning surveys. For many parts of the world this is a game-changer and will make biodiversity and forest carbon mapping much easier (and cheaper).
It does have some artefacts (teething trouble?), but the real challenge is not knowing when the data was collected for any given location. Until there is metadata on the time of acquisition, I expect this map to be a starting point for most people and not a last-mile solution.
Despite its flaws, it is a great resource that is close to lidar-quality data when in optimal conditions.
Earth Blox verdict
A great step forward for global forest mapping, but can do better.
Pros:
✅ It is the only tree-level canopy height model available for the whole globe.
✅ You can certainly see individual trees.
✅ Since it is canopy height (not biomass) you can use your own locally specific allometric equations to convert height to biomass, and therefore be more confident in the result.
✅ The whole map is free to access for everyone: for research, NGOs and commercial users.
✅ Underlying the method is very detailed global imagery (0.5m pixels), so at worst, it's a good tree/non-tree map (with the buildings removed).
✅ You can use it for tasks such as ecosystem fragmentation (for biodiversity scores) and estimating forest carbon stock (with the caveats below).
Cons:
❌ As with all global maps, it can have a good global performance but may perform poorly in any specific location.
❌ Areas with persistent cloud cover may have artefacts (expressed as areas of no canopy). Unhelpfully, these areas are not flagged in the data.
❌ Tiling artefacts means that you should corroborate this data with other sources when looking at specific project areas.
❌ The lack of temporal consistency means that it is not always clear when the data was collected for any specific location (which could be any time between 2009 and 2020).
❌ As with many similar products, this is just a snapshot, so can’t be used to map change.
Technical specs:
- Ground sample distance (pixel size): 1m
- Coverage: Global terrestrial surface.
- Metric: Vegetation canopy height (m) for all vegetation >1m in height.
- Date range: Nominally 2018-2020
Expert review by Prof Iain H Woodhouse
What kind of data is it?
Meta and WRI have teamed up to produce this global vegetation canopy height map on a 1m grid. The map should capture any vegetation that is higher than 1m, and claims a mean absolute error of 2.8m.
Meta is the company that used to be Facebook, and now also owns and operates Instagram, Threads, and WhatsApp, among other products and services. They have a strong AI team, and the Segment Anything Model (SAM) that they launched in 2023 has rapidly become a standard tool for segmenting any kind of image, including satellite imagery. WRI is a global research non-profit organisation that generates many environmental datasets, including the Aqueduct Water Risk Atlas. In collaboration with the University of Maryland and Google, they developed Global Forest Watch (GFW), a popular web application that uses Landsat satellite imagery to map forest changes.
How was it made?
This map is based on very high-resolution (0.5m) Vivid2 global mosaic from Maxar. They adapted a Meta AI model (DinoV2) that was originally designed to infer depth information from 2D images to infer vegetation height from 2D images from above (aircraft or satellite images). They then trained this model against some canopy height measurements from airborne laser scanning data. An article describing the methodology is published in the respected journal Remote Sensing of Environment. In the article they describe how they tested the data against field data, human interpretation and GEDI data (a laser scanning system on the International Space Station).
The way the model derives the canopy information is similar to how you would interpret the following aerial image:
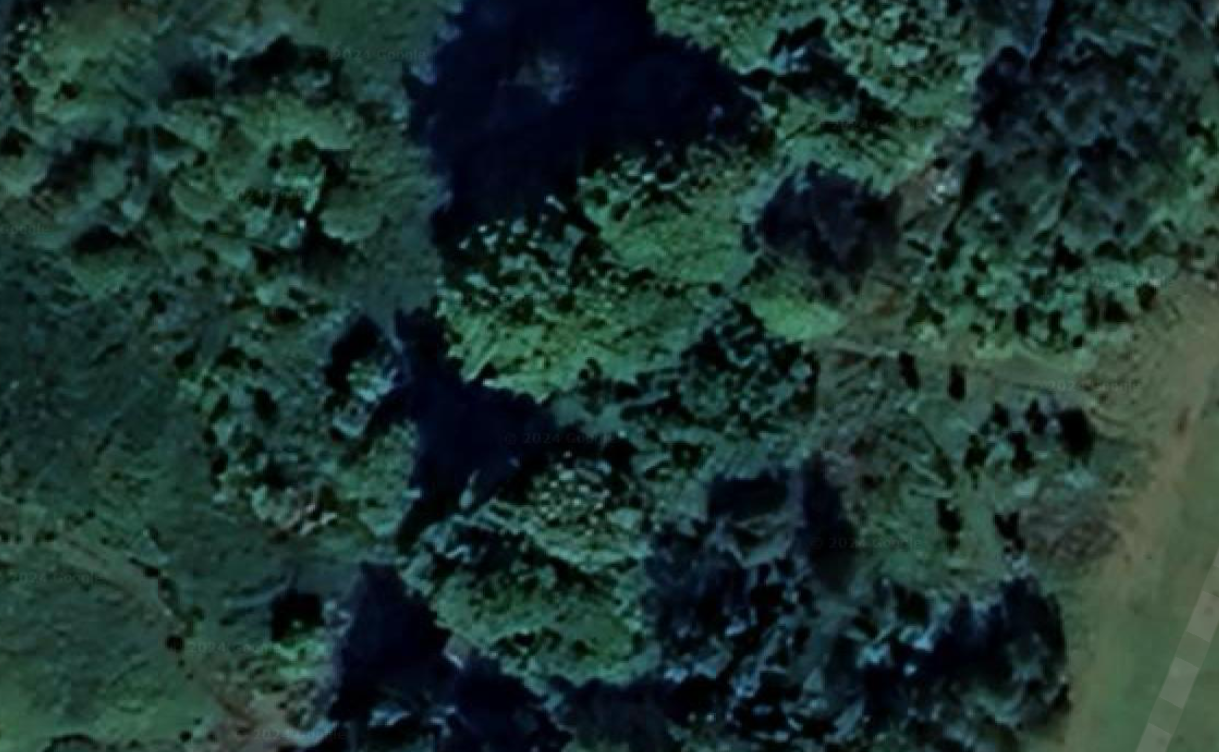
Canopy cover, aerial image.
Your brain has enough experience with trees to know the larger looking canopies in the middle of this image are larger and therefore likely to be taller. To the left and right are smaller, and therefore shorter, trees. The AI model is essentially doing the same thing but over the entire planet.
It is important to stress that this map has been created from sub-metre imagery. There are some researchers that have claimed an ability to generate 1m images from 10m Sentinel 2 data, but these results are essentially a deduction by the AI model and their reliability is questionable. It is only the height that is derived by AI in the Meta/WRI map, whereas the location of the trees should be at 1m resolution.
Can it really see individual trees?
Short answer: yes. With a 1m grid of data points, large trees should be apparent. We have made the Meta/WRI map available to Earth Blox users so they can evaluate it themselves, and I did some of my own analysis on our platform. I compared the map to some archived airborne lidar data (also 1m) from the Scottish Government to look at some woodland areas near my home. The images below are: lidar, Meta, and a Google Maps satellite image, respectively.
.png)
West Lothian woodlands: lidar (left), Meta (middle), Google Maps satellite image (right).
In terms of identifying individual trees, or collections of trees, it visually looks pretty good. It is impressive to have such a map cover the whole planet, meaning that areas of the world that would typically not be able to access airborne laser scanning data (Lidar) could use this product for some applications. Note how the buildings have been removed in the Meta/WRI map, but not in the Lidar map.
In terms of canopy heights, I found it performed well in all the areas in the UK that I had lidar data for, with R2 from about 0.6-0.8, and similar mean absolute error as quoted by Meta/WRI. This probably reflects the fact that the model has been trained on temperate forest areas in the US, so we might expect it to work best in similar areas.
Where does the map perform less well?
It is a common problem with all global datasets that while they might work well overall, they don’t always work in any specific location. This typically means that if you are calculating estimates over national or regional areas, a global map should work well. If you are at the project level (hundreds to thousands of hectares), I would always recommend you use a combination of different maps and either expert knowledge (from project partners or the literature) or field data to cross-reference and corroborate the map for your given area.
So, where does the Meta/WRI map fall down? The first issue is in the tiling. The processing approach they have applied breaks the globe down into tiles, and these tiles are processed by the AI individually. As a consequence, you will occasionally see artefacts at the join of these tiles, or where different strips of data have been used. Here are a couple of examples (one from the wet tropics in the DRC and the second from Malawi in the dry tropics):
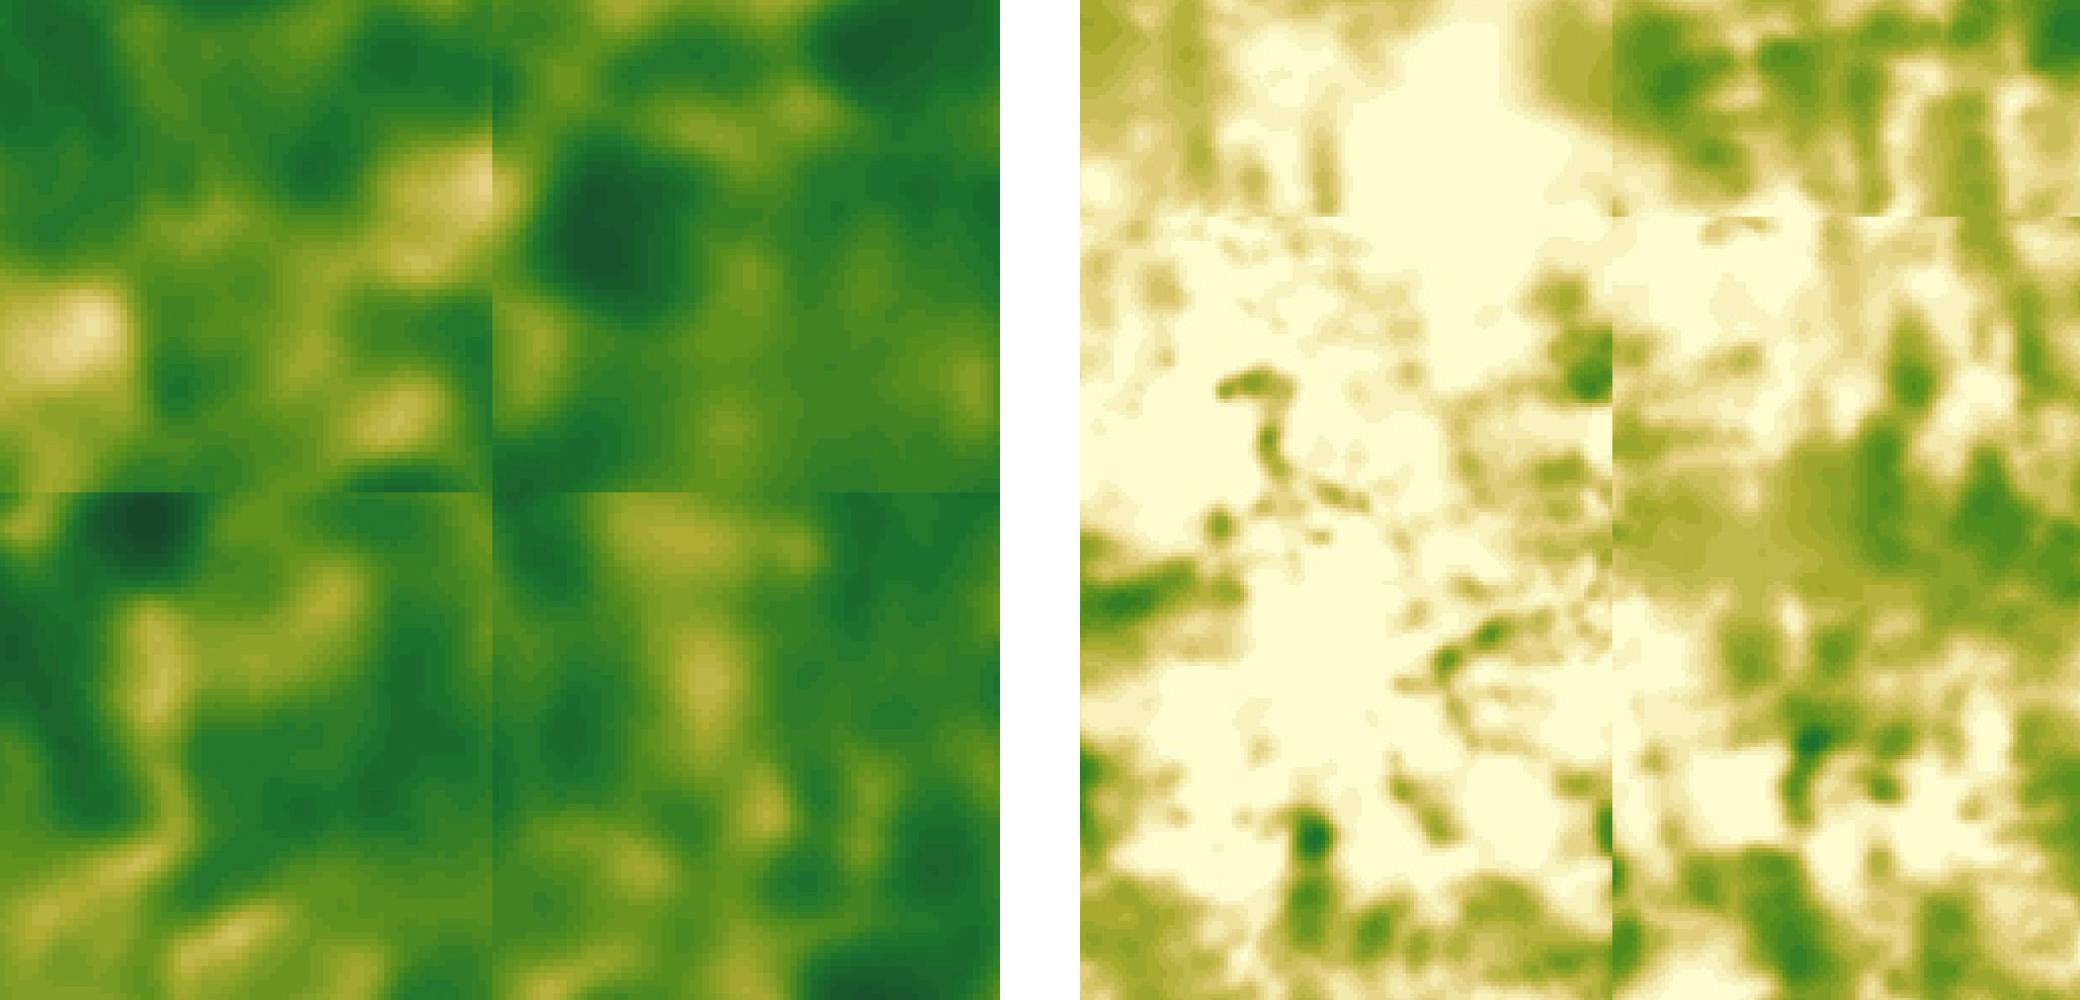
Wet tropics in DRC (left), dry tropics in Malawi (right) from Meta Global Canopy Height (1m).
If your project happens to lie at the boundary of two (or four) tiles, then you should be careful how you use and interpret the data.
The second problem is temporal effects. Meta/WRI say that about 80% of all the data used comes from the period 2018-20, but that in some areas (typically where there is persistent cloud cover) the data may be as old as 2009.
Take a look at this difference map I created with some lidar data where the blue indicates that the Meta/WRI map is higher than the lidar data, and red indicates that it is lower.
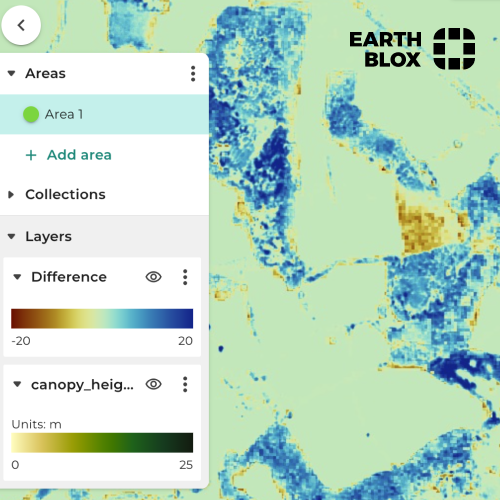
Lidar data map created on Earth Blox.
The general trend we found in this part of the world was that the Meta/WRI canopy heights were overestimated compared to the lidar data. This might be because the lidar data was from 2012 in this example, and perhaps all the trees have grown between then and 2018-20. But clearly the red area is where there has been felling. But I am only able to interpret that because I have the other data to compare it to, and I have no indication of what time period that felling may have occurred – it could have been any time since 2012.
Here is another example, this time from Malawi, and this time I don’t have corroborating data. On the left is the Meta/WRI canopy height, and on the right is the Google Maps satellite image.
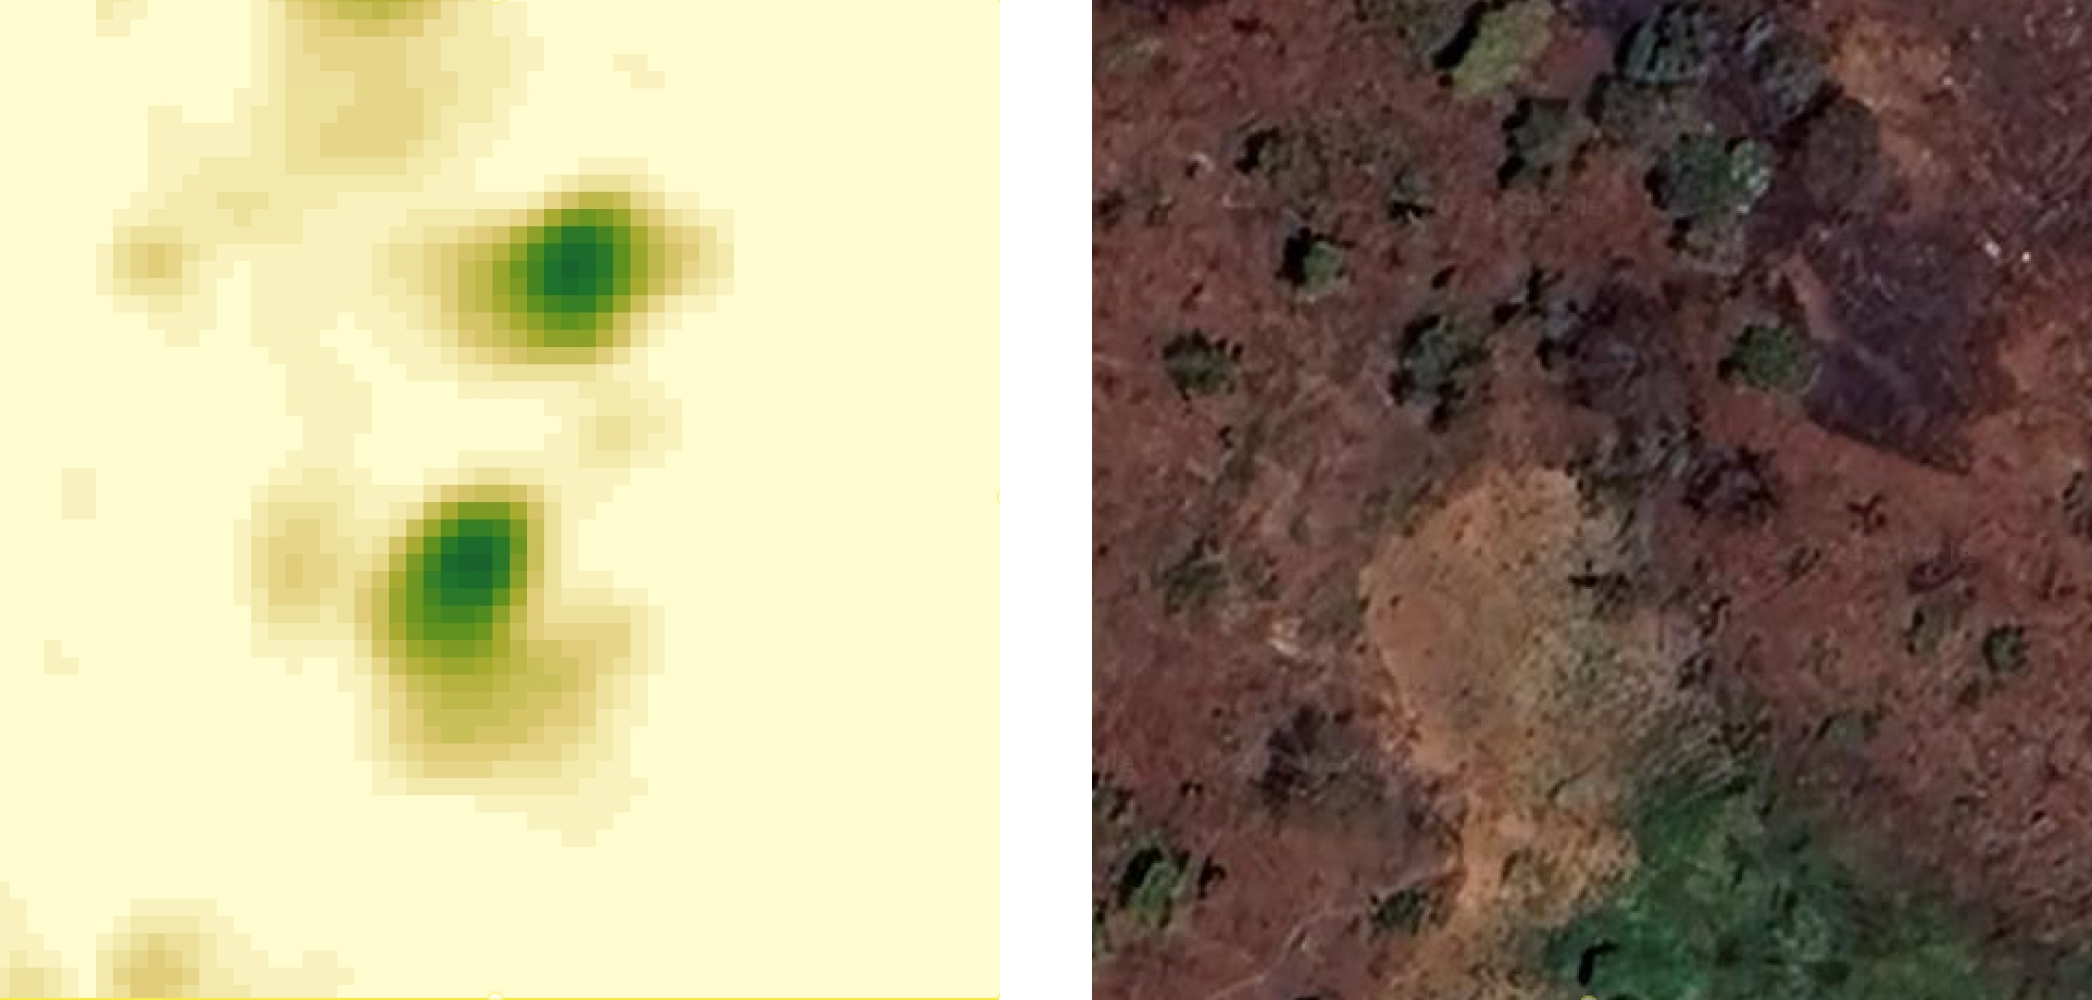
Malawi, Meta/WRI canopy height (left), Google Maps satellite image (right).
The blobs of high canopy do not seem to align with any vegetation features in the satellite image. Since there is no time stamp, it is not possible to determine if these are just artefacts of the AI model, or a change in the surface cover that happened between the two image dates.
The good news is that the WRI team have said they will eventually release a map with the time stamps on it so that for any given area you will know when the data was collected. This will be extremely helpful.
The third and final problem is cloud cover. The images below are from central Borneo. They are, respectively, canopy height at 10m from the Lang et al product, the Meta/WRI 1m canopy height, and a Google Maps satellite image of the same location:
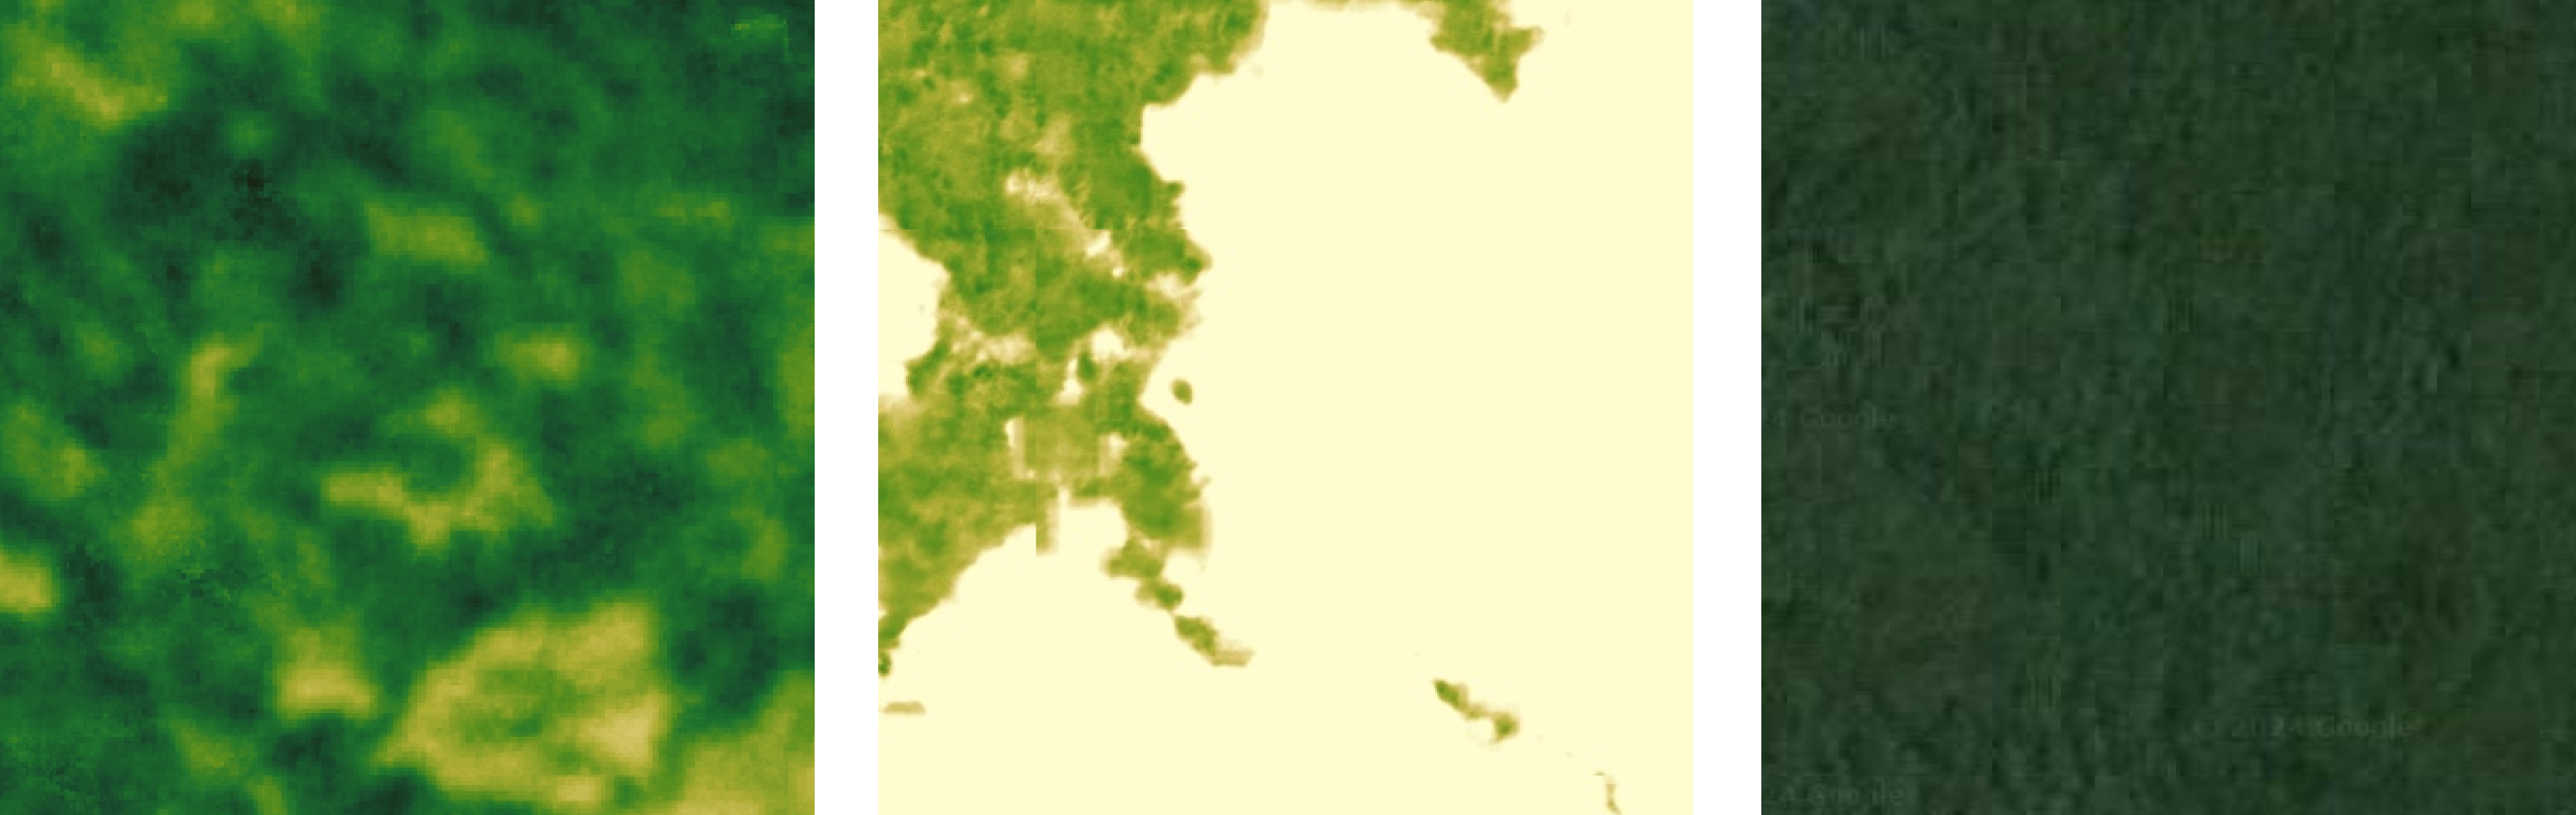
Canopy height at 10m from the Lang et al product (left), Meta/WRI 1m canopy height (middle), Google Maps satellite image (right).
The Meta/WRI product shows a large gap in the forest, whereas the 10m product and the Google image clearly show continuous forest cover. From the shape of this gap and its location in central Borneo, I would guess this is a cloud artefact. The AI model thinks the cloud is an area of bare ground. The real challenge here is that there is nothing to flag this up as an issue in the data. If your project area lies in an area of persistent cloud cover, then be very careful with how you interpret this map.
Similar products
Global Canopy Height 2020: A high-resolution canopy height model of the Earth for the year 2020.
Suggested alternatives
Global Canopy Height 2020: A high-resolution canopy height model of the Earth for the year 2020.
To access this dataset on Earth Blox, book a discovery call here.
Professor Iain H Woodhouse
Iain H Woodhouse is Knowledge and Outreach Lead at Earth Blox and Professor of Applied Earth Observation at the University of Edinburgh. He specialises in active remote sensing, with over 27 years experience in academia and industry, and more than 100 publications. Iain has advised multiple UK government agencies on EO strategy and is former Chair of the UK Space Agency’s EO Advisory Committee.
Add the first post in this thread.